
Hopefully these areas for you to review help you with why your app is running slower than you would like. However, if you have reviewed all of them and adjusted your app accordingly and it is still slow then please contact BlueFinity Support who will be happy to help you review further.
Database

Consider how many users are running your app and accessing the database simultaneously. Different databases have different restrictions e.g. SQLExpress limits you to 1Gb of ram and 1 CPU and so if the database starts to get bound you may need to invest in SQLServer that does not have this restriction. MultiValue databases may need more sessions running. These can be configured (purchased) in mv.NET or in ther connectivity products, as applicable.
Try running a selection that you have in your Evoke design directly against your database and see how long that takes. If it takes a long time then you will need to opptimise at the database e.g. add Index files, refine the selection, etc.
When an App is running try using the F12 developer tools and using the "performance" or "Network" option to see where your app is experience slowness and if this is the database. Every browser is slightly different but here is a good user guide to the Chrome F12 Developer tools.
Browser

- You can Page your data into the Browser DOM. Using "PagingUIOnly" in Evoke's data paging means that all data is retrieved in one roundtrip to the repository (database) and over the communications network but that the UI (grid) display will be paginated meaning it is built in stages and displayed as built.

When Data Paging is used the user of the App will need to be able to see how many pages there are in total and navigate from one page of data to another. This is achieved via a Data Paging bar that is displayed on the appropriate data grid in the App (as shown in the data paging help section ).
The General Settings section of each multiple entity Template (as shown on the right) has a "Show data paging bar" check box. This is used in conjunction with Data Paging to show the data paging bar on a specific data grid. When data paging is used on a datasource (i.e. the data paging option is set to either PagingFullBuffering or PagingUIOnly) this checkbox should be checked on data grids/tables that display it in the UI.

Communications

The first is you can Page your data over the communications network. This means that by using "PagingFullBuffering" in Evoke's data paging the data to be retrieved from the database by the app, on-demand, in chunks (pages) and each chunk transmitted over the communications network (Internet) seperately. After transmission of a chunk, it is retained in memory by the App together with all the other chuncks.
If you know that some of your users will be reguarly on a very slow communications network or that they have a "metered Connection" (A metered connection is an Internet connection that has a data limit associated with it. Cellular data connections are set as metered by default. Wi-Fi and Ethernet network connections can be set to metered but aren't by default.) then you can restrict sending photos to them as part of the data transmitted to the app.
Please Note: The Metered Connection Check property in the Image Template controls if an image is transmitted by user. If the boolean property "OnMeteredConnection" in the AppUser Entity is set to {true} then the image is not downloaded to the device to save using the users "data" allowance and also the time to transmit the images over the network.
Design

The most common is retrieving related data unnecessarily. Using the screen on the right as an example, the entry of 3 characters from the Customer name runs a selection that returns a short or potentially long arrary of customer records. Each of these records have associated contacts and orders (see smaller boxes at the foot of the screen.
If you performed a selection to return the customers but then also performed a RetrieveRelatedData to retrieve all the contacts records for every customer and all the orders for every customer and all the order lines for every order then this would result in multiple trips to the database, and potentially a delay when you might only need the contact records/order records associated with a customer record when you click on that line.
The orders, contact, order lines, deliveries, etc are related to the Customer records as either Joins/Link tables (SQL) or local/remote keys or Embedded Multivalues (Multivalue). Therefore, on the main customers segment shown use click actions (as shown left) to retrieve (RetrieveRelatedData) these records when the line is clicked on and just for the record required. This process will then be quick and efficient and you will not be retrieving additional data from the database that is not going to be used.

Other
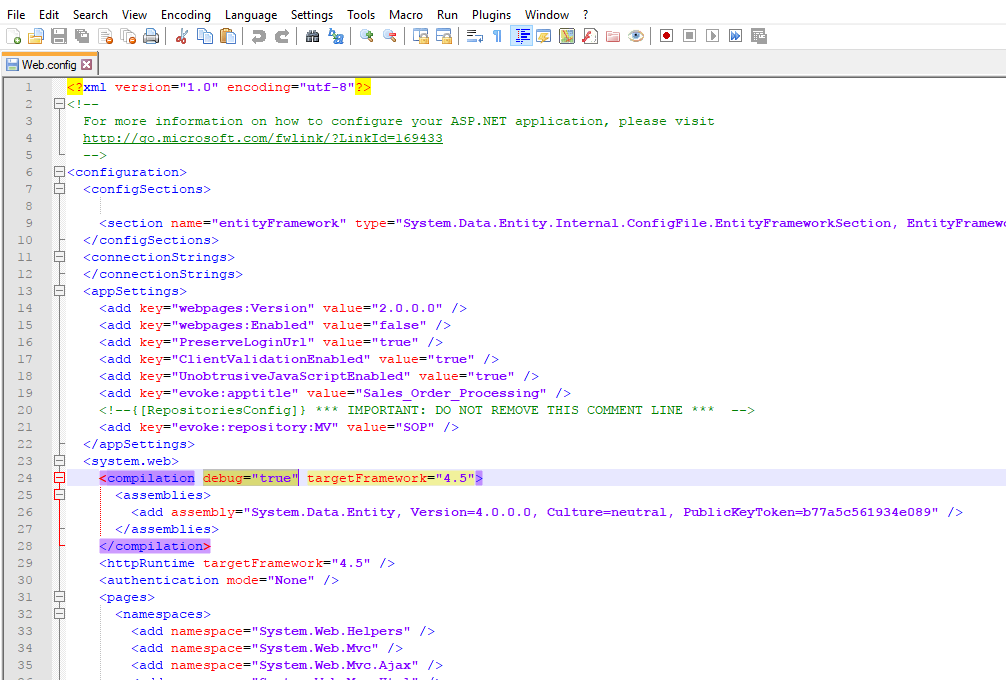
- When you deploy your web app and the folders have been copied to the web server it is good practice to edit the file web.config located in the web folder. There are several editing tools that can edit this file including Notepad or Notepad++. An image of the web.config file appears on the right, click on the file to open a larger image.

The parameter Compilation debug="true" (highlighted) is automatically set by Visual Studio when you initially build your app, setting this to "False" will dramatically reduce the size/footprint of your app. The first time you access your app, after you have deployed it, the Web server optimises and compacts the app payload. This means that the first time it is accessed there will be a delay in the app coming up - We suggest that after deployment you access the app, through a browser to a) check it is working as you expect and b) to allow the server to optimise and compact the app payload so that you experience this delay before your users use the app.
During app development it is recommended that you use the browser function Control-FunctionKey5 (Cntl F5) to flush the cache and reload all web components. This will always be a slow process as all cached components and images etc are reloaded. When your app is deployed and running it is recommended that you only perform a control F5 if you really need to.
When you deploy a new version of your app for your users, you can force a one time browser cache flush and reload at the users device by using the Publish Version ID, which is manually incremented to force a browser cache reload.